Process monitoring follows strictly the rules of 5r
It is fairly easy to stop a machine based on some data. The art of effective process monitoring is to acquire the right data, transport and present it in a manner, that human beings or algorithms based on this process monitoring information make the right decisions. The basically unproductive emergency stops of machines based on live data is only a small facet of process monitoring. Way bigger leverages are typically realized in inter-divisional data usage. The nice side-effects are:
- Efforts for data acquisition of good data leads to multiple benefits in several departments.
- Usage of mutual data sources leads to mutual understanding in separate divisions.

The right data sources and contents
A very fundamental insight is to use the right data. Of course, this corresponds with the target of the specific task. Anyway, our experience is, that fundamental logical or physical data is usable for several tasks. The following list sumarizes some typical data sources, which are helpful to find and solve technical root tasks.
Examples for physical data in presses:
Force
- Left-, right connecting rod
- Cutting tool in stage 1, 2, ...
- Blankhoder forces
- Break
Acceleration signals
- Ram
- Motor
- Baseplate
- Machine-table
- Tool
- Slide feed…
Torque
- Motor
- Axle
- Roll…
Current
- Motor
- Laser
- Break…
Measured velocity, measured position
- Strip
- Wire
- Slug
- Tool
- Ram …
Examples for typical logistic data in presses:
Quantity per time unit
- Good parts
- Scrap
- Strokes
- Orders
- Setup-tasks
- Mmicro stops
- Stops …
Identification number
- Order
- Tool
- Material
- Product
- Machine …
Duration of
- Stop
- Setup
- Maintenance
- Waiting
- Repair …
Isolated, the single data sets are in most cases worthless. The worth is generated, if the right data is presented at the right time to then right person etc. In this case the data bears information and leads to good decisions. We offer fitting Sensors and Systems, which allow acquiring, processing transport and visualization of data in high quality. Our systems are built to connect to local systems, this boosts existing infrastructure. For the special needs of producing companies, we developed special sensors, where needed. These industrial sensors convince with robustness, simplicity and precision. Wherever possible, we integrate existing solutions.
The right location of data presentation
Typically, the right location means the location, where a decision is made. In producing companies this might be:
At the machine
- Is there a need to interrupt the process?
- Is the need for a stop?
- Are more strokes per minute possible?
- Should the worker make contact to a team leader and report?
- ...
In the design office
- Which tool(-type) has often which problems?
- Which tool leads to high stresses in the machine?
- What is the reason for machine loads, what options has the tooling for reductions?
- What options are possible for more productivity?
- …
At the responsible for tools
- Which tool leads to high stresses in the machine?
- What is the reason for machine loads, what options has the tooling for reductions?
- What options are possible for more productivity?
- ...
In the requirements list for the next machine
- What is the operation of the machine like?
- Which loads are relevant?
- Which enhancements are expected?
- ...
This list cannot be closing. Much more, it shall be an inspiration to identify “data-stakeholder” in the early IoT design-phase. With this knowledge, it becomes an easy task to identify needed data quality and rules for preparation for the later usage.
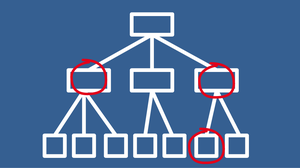
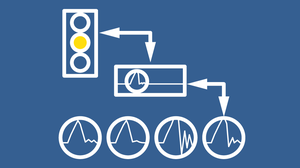
This sub-chapter shows impressively that the same data sources will unfold their potential, if the are available to the right person at the right time. For clarification of this task, we often use the IoT-Hourglass-model and the layer-model for data abstraction.

The right time of data usage and data access
In practice implementations the topic of time with all micro and macro dimensions is huge. For simplification reasons at this place, we are clustering the topic time strongly into the following dimensions of time.
Before production for
- … setup
- … operations scheduling
- … engineering
- …
During production for
- … securing processes
- … control machines and workers
- … track progress
- …
On whish of a user for
- … support for a special task
- … enhancements of design
- … deriving of requirements
- …
On whish for another employee for
- … clarification of specific tasks
- … delegation of tasks
- … report of results
- …
This listing indicates that data is pushed to users in some cases and in some cases, user pull data as soon as the time is right for analysis or submit datasets to thirds for some reason. Basically, it is absolutely normal that month can pass until the right moment for the data access is there. When it comes, data needs to be accessible and presentable fast and easy. From this whish, we derive requirements for the IT-systems. The successful implementations depend on the smooth combination of expertise and separation of concerns on IT-side. Of course, this integration is feasible stepwise. We willingly support with our expertise and experience.
The right data quality and form of presentation
Data quality has many dimensions. Much too often, it is reduced to sampling rate or ranges. With this reductio the aspect of physical correctness is often lost. From a technological point of view the Signal to noise ratio (SNR) is at least as important. For practical usage the quality of presentation to the user cannot be overestimated. Form a user-oriented point of view, the following use-cases must be considered and supported with proper data:
Ample at the machine
- Minimum of presented data
- Maximized degree of abstraction
- Stimulates fast ad-hoc-reaction
Dashboard in the intranet
- Strongly abstracted / focused
- Strongly standardized in order to fit to other graphs
- Fixed
Data-viewer (e.g. SmartEvaluator)
- Full scope of data
- Full access to depth of data
- Standardization possible
Reports
- Static represented data
- Specified content for specified usage
- Standardized
Presentation
- Individual reports for project-like presentation
- Typically, synthesis of reports, data-viewers and other data sources
Regarding the originate data quality that is acquired and stored, one can summarize, that the minimum quality for stored data needs to meet the expected maximum planned presented quality. The layer-model of data-processing shows: Speaking key performance indicators KPIs need high quality data in order to represent the process safely. A proper data management always allows deep-drilling into fundamental raw-data.

The right quantity of acquired, processed and presented data
Like data quality, the field of data quantity has many dimensions. Due to capacity reasons, the amount of stored and transferred data needs to be fitted to given resources by selection, compression and suitable garbage-management. Additionally, dashboards, user-interfaces and last but not least the user have restriction concerning the feasible data exchange:
Capacity of storage
- Compression
- Garbage-Management
- Access time
Network bandwidth
- Route,
- Need for throughput
- Costs
- Form of presentation
- Resolution
- Zoomability
Availability of recognition
- Information- points
- Information- density
The art of handling the data quantity in industrial series production is to build a leveled system, that supplies all needs of quantity and stays flexible and dynamic. The choice of storage points, transfer routes and locations of processing is tremendous important for systems that fulfil todays need and fit into tomorrow worlds. Setup of IoT-Systems in inductrial surroundings is our daily profession. We install systems in cooperation with the customers IT, that record data of machines with every detail, calculate speaking KPI and ship data into the customers dashboard or IoT systems.
Contact us, if process monitoring matters in you company or daily business.
We build systems for data acquisition and processing on the shopfloor every day. Thus, we developed a pragmatic approach for digitalization on the shopfloor. We help to make feasible plans that describe the 5r of data logistics in your digitalization task. We describe the tricky points quality and quantity and help to build an IoT concept, that fits into your environment.
Based on our long experience in different digitalization projects, we as mechanical engineers speak the language of your engineers, workers and IT-department. This allows us to bridge existing or upcoming gaps and realize digitalization in your production efficiently.
We help making the right steps. Your first step could be, to make schedule a call here. We bring along the needed experience to make things easy.